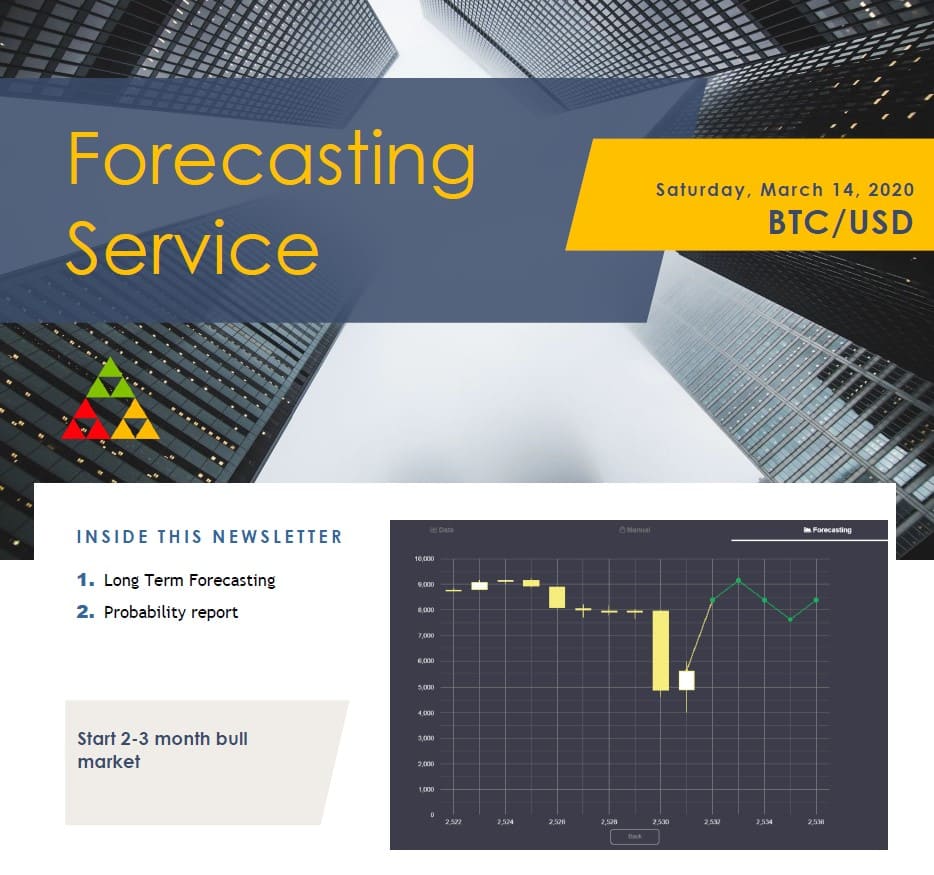
Long and short term forecasting BTC/USD, BRENT CRUDE OIL


This educational service enables you to experience the application of Trading Assistance analysis with short-term charts (using weekly data), intermediate-term charts (using monthly data), and long-term charts (using 6-monthly data).
Forecasting charts using daily data: this timeframe is perfect for you if you're interested in learning how to apply technical analysis to short-term charts.
Forecasting charts employing weekly data: If you're looking for intermediate-term market insight and technical analysis theory education, plus you're a "do-it-yourself" investor, focus on these charts and this timeframe.
WEEKLY: If you want to learn how to apply Trading Assistance forecasting techniques to short-term candlestick charts (using weekly data), this is the perfect timeframe for you.
MONTHLY: If you're looking for intermediate-term market insight and multiple technical analysis, plus you're a do-it-yourself investor, focus on these charts (using monthly data).
1/2-YEARLY - Published to subscribers in January and July, these long-term candlestick charts (employing 6-monthly data) offer significant perspective.
Every Monday afternoon: Short-term charts are released.
First Sunday of every month: Intermediate charts are released.
First Sunday of every quarter: Long-term charts are released.

NOTE: Release schedule is firm except for national holidays and Trading Assistance summer and winter vacation periods.